- Add new tree to project
- Change the branch and leaf colors of the tree
- Upload datasets to tree
- Add pie charts to the tree
- Add bar plots to the tree (next to the leaf labels)
- Add dot plots to tree
- Add colored objects/ shapes to the tree (next to the leaf labels)
- Add Heatmap data to tree
- Show/Hide bootstrap,branch length values
- Multiple column plots with Evolview trees
- Add Timeline view to Evolview tree
- Export the tree to pdf file
QUICK START
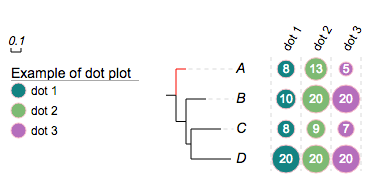
Add dot plots to tree
Follow the Upload dataset steps. Select the upload dotplot dataset option. Let's see some examples: Select the "Sample tree 2" from upload tree window to load the following tree.Here is tree in newick format:
(A:0.1,(B:0.2,(C:0.3,D:0.4)100:0.05)100:0.1)90:0.43;
... and an example dataset:
##dot plots
!groups	dot 1,dot 2,dot 3
!colors	#028482,#7ABA7A,yellow
!title	Example of dot plot
# -- legends --
!legendstyle	circle
!showLegends	1
## -- if !scalebycol is set to 1, each column of data will be scaled independently
!scalebycol	0
!byarea	1
# ---- grid and grid label / group label are also supported --
!grid	1
!gridlabel	1
# stroke and stroke color also work here
!defaultStrokeColor	pink
#!defaultStrokeWidth	2
# here shape can be 'rect' or 'circle'; roundedcorner only applies to 'rect' shapes ...
!dotplots	shape=circle,margin=2,colwidth=30,roundedcorner=3
## -- show data value works at here as well --
!showdataValue	show=1,fontsize=12,fontcolor=black
A	8,13,5
B	10,20,20
C	8,9,7
D	20,20,20