- Add new tree to project
- Change the branch and leaf colors of the tree
- Upload datasets to tree
- Add pie charts to the tree
- Add bar plots to the tree (next to the leaf labels)
- Add dot plots to tree
- Add colored objects/ shapes to the tree (next to the leaf labels)
- Add Heatmap data to tree
- Show/Hide bootstrap,branch length values
- Multiple column plots with Evolview trees
- Add Timeline view to Evolview tree
- Export the tree to pdf file
DATASETS
PIE CHARTS
Table of contents
Overview
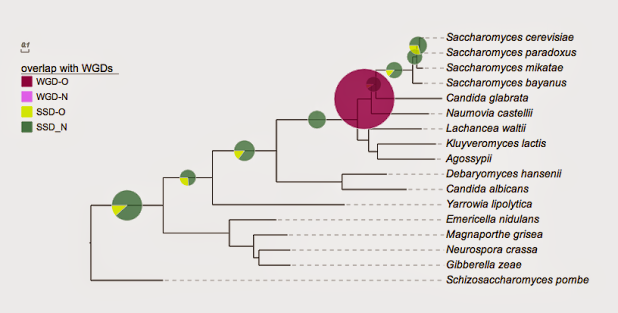
Pies will be displayed on internal and leaf branches. Here is an example:
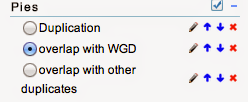
User can upload multiple pie-chart datasets to a tree, but only one can be displayed at a time. Using the control panel on the page left, user can control which one can be displayed:
Supported modifiers
Supported Key-Value pairs for pie charts:
| Key (case insensitive) | Value | Description |
|---|---|---|
| universal modifiers | ||
| !Groups or !LegendText | comma separated text | Legend texts; for example 'group_a,group_b,group_c' |
| !LegendStyle or !Style | rect or circle or star | shapes to be plotted before the legend texts; default = rect |
| !LegendColors or !Colors | comma separated color codes or names | colors to be applied to the shapes specified by LegendStyle; for example 'red,green,yellow' ;note the number of colors should match the number of legend fields |
| !Title or !Legend | text | title of the legend; default = name of the dataset |
| !ShowLegends | 0 or 1 | 0 : hide legends; 1 : show legends |
| !opacity | float number between 0 to 1 | opacity of the dataset |
| pie charts specific | ||
| !minradius | any float number > 0 | minimal pixel radius of the pies |
| !maxradius | any float number > 0 | maximal pixel radius of the pies |
| !area | none | use user inputs as the areas of the pie charts |
| !radius | none | use user inputs as the radiuses of the pie charts |
| **new: show data values | see section #show data value for more details** |
notes on preparing your dataset!!
- please always use TAB to separate the modifiers and their values.
- some modifiers should not be used in combination, e.g. !area and !radius are mutually exclusive.
- However if both are used (accidentally), only the last one will be used.
- if a modifier is used (accidentally) multiple tiles, only the last one will be used.
- the "data" part of this dataset can only contain two columns of tab-delimited texts; the third column, if presents, will be ignored
Examples
The following we will provide you some examples.
You can copy & paste the tree and datasets to EvolView to reproduce the results.
The tree (in newick format):
((((((((((Saccharomyces_cerevisiae:0.054377,Saccharomyces_paradoxus:0.039196)Saccharomyces_subclade:0.035915,Saccharomyces_mikatae:0.082075)Saccharomyces_subclade:0.054132,Saccharomyces_bayanus:0.128022)Saccharomyces:0.485857,Candida_glabrata:0.874698)Saccharomycetaceae_subclade:0.060179,Naumovia_castellii:0.761269)Saccharomycetaceae_subclade:0.182516,(Lachancea_waltii:0.700985,(Kluyveromyces_lactis:0.770604,Agossypii:0.758273)Kluyveromyces:0.118441)Saccharomycetaceae_subclade:0.146942)Saccharomycetaceae:1.069627,(Debaryomyces_hansenii:0.591048,Candida_albicans:0.851762)Saccharomycetales_subclade:0.866539)Saccharomycetales_subclade:0.844816,Yarrowia_lipolytica:1.745091)Saccharomycetales:0.650477,(Emericella_nidulans:0.618015,(Magnaporthe_grisea:0.446021,(Neurospora_crassa:0.412753,Gibberella_zeae:0.414866)Sordariomycetes_subclade:0.071418)Sordariomycetes:0.318914)Pezizomycotina:0.873484)Ascomycota_subclade:0.955079,Schizosaccharomyces_pombe:0.952249);
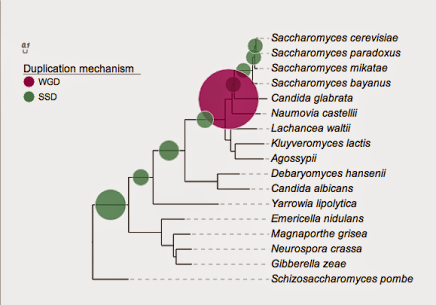
dataset 1: "Duplication"
## for evolview; Yeast
!Groups	WGD,SSD
!colors	#9F0251,#4D8963
!legendstyle	circle
!title	Duplication mechanism
!opacity	0.8
Saccharomyces_cerevisiae,Saccharomyces_paradoxus	0,19
Saccharomyces_cerevisiae,Saccharomyces_mikatae	0,20
Saccharomyces_cerevisiae,Saccharomyces_bayanus	0,18
Saccharomyces_cerevisiae,Candida_glabrata	0,22
Saccharomyces_cerevisiae,Naumovia_castellii	862,0
Saccharomyces_cerevisiae,Lachancea_waltii	0,29
Saccharomyces_cerevisiae,Candida_albicans	0,53
Saccharomyces_cerevisiae,Yarrowia_lipolytica	0,26
Saccharomyces_cerevisiae,Neurospora_crassa	0,169
important!
- an internal branch / node is identified by the names of two leaf nodes; the former is the last common ancestor of the latter
- the values of an internal branches are separated by ",", e.g. 0,19
- the number of values of all internal nodes should be the same (two in this dataset)
- the same number of colors should be provided by "!colors" ("#9F0251,#4D8963" in this case)
- and the same number of "groups" should also provided by "!groups"
dataset 2: overlap with other duplicates
# for evolview; Yeast
## created at may 25, 2011
!Groups	WGD-O,WGD-N,SSD-O,SSD-N
!colors	#9F0251,#f88ef9,#effc00,#4D8963
!legendstyle	circle
!title	overlap with other duplicates
!opacity	0.8
Saccharomyces_cerevisiae,Saccharomyces_paradoxus	0,0,24,14
Saccharomyces_cerevisiae,Saccharomyces_mikatae	0,0,14,11
Saccharomyces_cerevisiae,Saccharomyces_bayanus	0,0,13,16
Saccharomyces_cerevisiae,Candida_glabrata	0,0,4,18
Saccharomyces_cerevisiae,Naumovia_castellii	77,792,0,0
Saccharomyces_cerevisiae,Lachancea_waltii	0,0,12,28
Saccharomyces_cerevisiae,Candida_albicans	0,0,18,42
Saccharomyces_cerevisiae,Yarrowia_lipolytica	0,0,11,16
Saccharomyces_cerevisiae,Neurospora_crassa	0,0,28,143
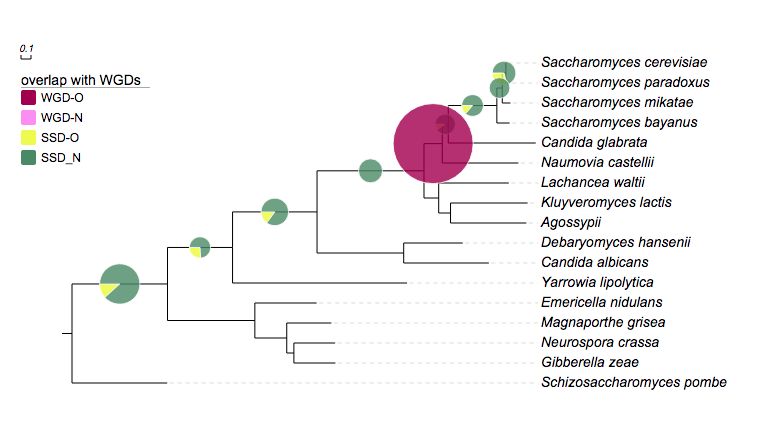
Show data values
First, let's see an example using the same tree as above:
## for evolview; Yeast
## created at may 25, 2011
!Groups	WGD-O,WGD-N,SSD-O,SSD_N
!colors	#9F0251,#f88ef9,#effc00,#4D8963
!legendstyle	rect
!title	overlap with WGDs
!opacity	0.8
!showlegends	0
!showDataValue	show=1,fontsize=12,fontcolor=darkblue,titalic=1
Saccharomyces_cerevisiae,Saccharomyces_paradoxus	0,0,11,27
Saccharomyces_cerevisiae,Saccharomyces_mikatae	0,0,0,25
Saccharomyces_cerevisiae,Saccharomyces_bayanus	0,0,4,25
Saccharomyces_cerevisiae,Candida_glabrata	0,0,2,20
Saccharomyces_cerevisiae,Naumovia_castellii	869,0,0,0
Saccharomyces_cerevisiae,Lachancea_waltii	0,0,0,40
Saccharomyces_cerevisiae,Candida_albicans	0,0,9,51
Saccharomyces_cerevisiae,Yarrowia_lipolytica	0,0,7,20
Saccharomyces_cerevisiae,Neurospora_crassa	0,0,20,151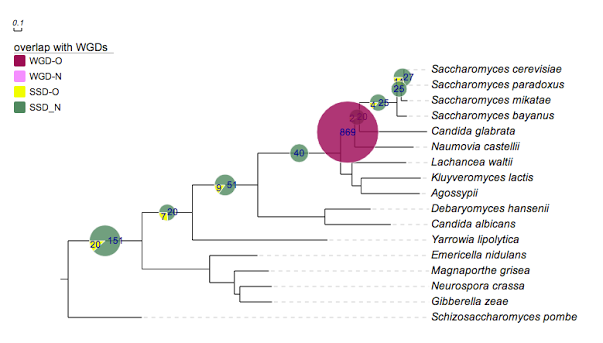
The 'value' of the 'key' !showdataValue can be any combination of the following, separated by a ",":
| modifiers | alternative value | description |
|---|---|---|
| show = 1 | 0 | show or hide data values; optional; the data values will be shown if omitted |
| fontsize=12 | any integer | set font size; optional; default = 10 |
| fontcolor=red | any valid HTML color name such as 'darkred' and hex color code such as '#FF0000' | set text color; optional; default = black |
| fontitalic=1 | 0 | set font italic; optional; default = 0 |
more examples will be added ...
Add pie charts to trees with collapsed internal nodes
Evolview supports collapsing at internal nodes; collapsed nodes are treated as leaf nodes. It is therefore very straightforward to add pie charts to a collapsed tree. See here for more information.