- Add new tree to project
- Change the branch and leaf colors of the tree
- Upload datasets to tree
- Add pie charts to the tree
- Add bar plots to the tree (next to the leaf labels)
- Add dot plots to tree
- Add colored objects/ shapes to the tree (next to the leaf labels)
- Add Heatmap data to tree
- Show/Hide bootstrap,branch length values
- Multiple column plots with Evolview trees
- Add Timeline view to Evolview tree
- Export the tree to pdf file
DATASETS
GROUP LABEL
please consult our examples trees 'group label', 'group label style 3' and 'group label style 4' in the DEMOS project.
Table of contents
Overview
Group labels will be showed next to the leaf labels:
- it falls into the 'Charts' category, and
- multiple Group Labels datasets can be displayed at the same time
- however, some styles (3, 4 and 5) have to be the first one of all charts; see examples below
Here is an quick example (display styles 5,2 and 1 out of in total 5 styles ):
Supported modifiers
Apart from the common modifiers such as those that are related to legends, Group Labels supports an additional modifier:
!groupLabel. The value of this modifier defines default settings for all group labels and can be any combination of the following, separated by a ",":
| modifier | alternative value | description |
|---|---|---|
| show=1 | 0 | show or hide group labels; optional; the data values will be shown if omitted |
| style=1 | any integer from 1 to 5 | visualization style of group labels; see the following section for more examples; default is 1 |
| color=pink | any color name or valid html hex colors such as #FF0000 | default color for group lines and labels; default = black |
| linewidth=2 | any integer >= 0 | set width of the group line; default = 1; if set to 0, the group line is hidden; valid only when style=1; see examples below |
| linestyle=dashed | if set, a dotted group line will be plotted; default is regular line; valid only when style=1; see examples below | |
| fontcolor=black | any color name or valid html hex colors such as #FF0000 | default color of group labels; default = black; if omitted, uses 'color' |
| fontsize=12 | any integer | set font size; optional; default = 10 |
| fontitalic=1 | 0 | set font italic; optional; default = 0 |
| textalign=middle | start or end | set text align; optional; default = middle; see the following examples |
| textorientation=horizontal | vertical | set text orientation relative to leaf label; default = horizontal; see examples below |
| bkcolor=colorname | any color name or valid html hex colors such as #FFFF00 | default color for group background; valid only when style = 2~5; default = lightblue |
| marginPCT=0.05 | any float value between 0 and 1 | white space between group labels; the larger the value, the more white space to show; default = 0.05 |
Data
Each line of the Data section usually consists two parts, separated by a TAB. The first part defines to where the group label will be placed, it can be either:
- names of two leaf labels, separated by a ',', or
- a name of a leaf label.
The second part specifics the 'label' (required) and optional settings for this label such as font color, size.
See below:
Visualization styles
The tree:
(chicken,((mouse,rat),(chimp,human)));
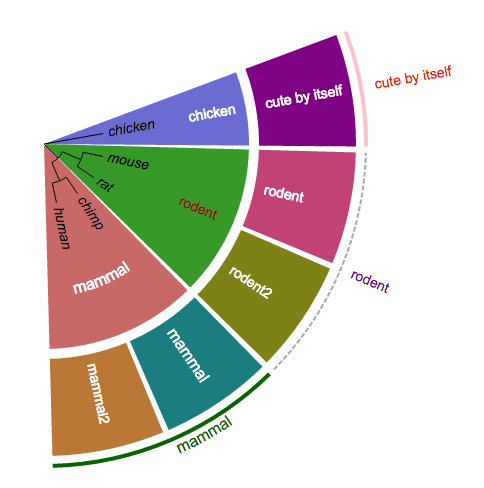
Style 1 (copy & paste the following contents to Evolview to view the visualisation results):
!grouplabel	color=pink,fontsize=14,fontcolor=black,linewidth=2
chicken	text=cute by itself,fontcolor=red,linewidth=4
mouse,rat	text=rodent,linecolor=darkgrey,fontcolor=purple,linestyle=dashed
chimp,human	text=mammal,color=darkgreen,textorientation=vertical,linewidth=4,fontsize=16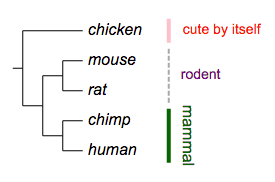
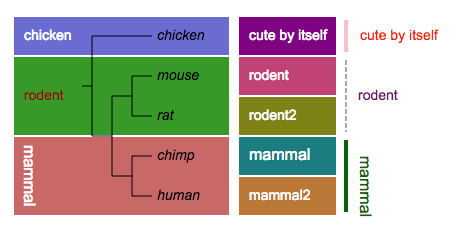
Style 2 ((copy & paste the following contents to Evolview to view the visualisation results):
!grouplabel	style=2,color=pink,show=1,marginPCT=0.05,fontsize=14,fontcolor=white,fontitalic=0,textalign=middle,textorientation=horizontal,linewidth=2
!op	0.8
chicken	bkcolor=#404AC3,text=chicken
mouse,rat	bkcolor=green,text=rodent,fontcolor=darkred
chimp,human	bkcolor=#BE4144,text=mammal,textorientation=vertical,linewidth=4,fontsize=16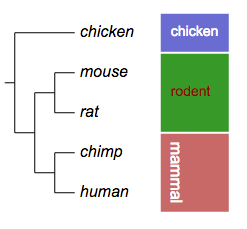
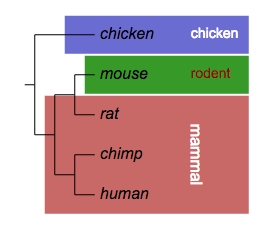
Style 3 (copy & paste the following contents to Evolview to view the visualisation results):
!grouplabel	style=3,color=pink,show=1,marginPCT=0.05,fontsize=14,fontcolor=white,fontitalic=0,textalign=middle,textorientation=horizontal,linewidth=2
!op	0.8
chicken	bkcolor=#404AC3,text=chicken
mouse	bkcolor=green,text=rodent,fontcolor=darkred
rat,human	bkcolor=#BE4144,text=mammal,textorientation=vertical,linewidth=4,fontsize=16
Style 4 (copy & paste the following contents to Evolview to view the visualisation results):
!grouplabel	style=4,color=pink,show=1,marginPCT=0.05,fontsize=14,fontcolor=white,fontitalic=0,textalign=middle,textorientation=horizontal,linewidth=2
!op	0.8
chicken	bkcolor=#404AC3,text=chicken
mouse	bkcolor=green,text=rodent,fontcolor=darkred
rat,human	bkcolor=#BE4144,text=mammal,textorientation=vertical,linewidth=4,fontsize=16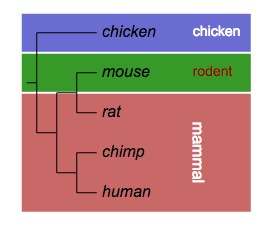
Style 5, here the group labels will be drawn on the left of the tree; in circular mode this wouldn't work so it'll be plotted as style = 4. (copy & paste the following contents to Evolview to view the visualisation results)
!grouplabel	style=5,color=pink,show=1,marginPCT=0.05,fontsize=14,fontcolor=white,fontitalic=0,textalign=middle,textorientation=horizontal,linewidth=2
!op	0.8
chicken	bkcolor=#404AC3,text=chicken
mouse	bkcolor=green,text=rodent,fontcolor=darkred
rat,human	bkcolor=#BE4144,text=mammal,textorientation=vertical,linewidth=4,fontsize=16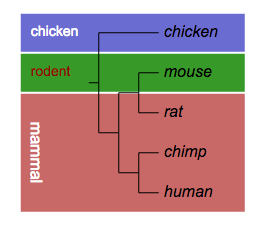
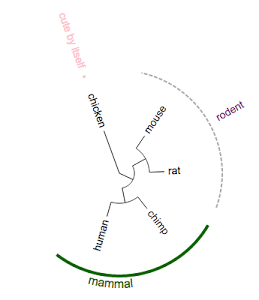
In circular mode, style 5 will be visualised as style 4:
Examples
copy & paste the following contents to Evolview to view the visualisation results.
Example 1:
chicken	text=cute by itself
mouse,rat	text=rodent
chimp,human	text=mammal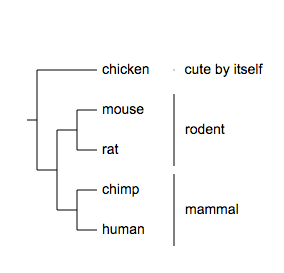
Example 2:
# group label ; color applies to both the group labels and lines ...
!GroupLabel	color=red
chicken	text=cute by itself
mouse,rat	text=rodent
chimp,human	text=mammal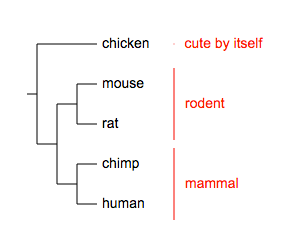
Example 3:
# group label ; now use a different color for the font; html hex color is also supported
!GroupLabel	color=red,fontcolor=#0000FF
chicken	text=cute by itself
mouse,rat	text=rodent
chimp,human text=mammal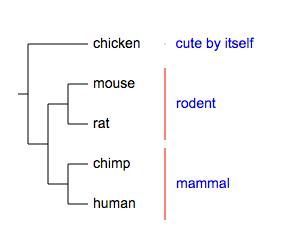
Example 4:
# group label ; a more complicated example
!GroupLabel	color=red,fontcolor=#0000FF,fontsize=20,fontitalic=1,textalign=start,textorientation=horizontal,linewidth=2
chicken	text=cute by itself
mouse,rat	text=rodent
chimp,human	text=mammal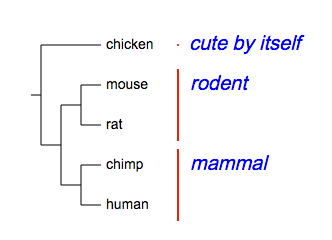
Example 5, textalign=start|end|middle:
## by default group labels are placed at the middle of the group line; the positions can be
## specified using textalign with one of the three options: start, end or middle
!GroupLabel	textalign=end
chicken	text=cute by itself
mouse,rat	text=rodent
chimp,human	text=mammal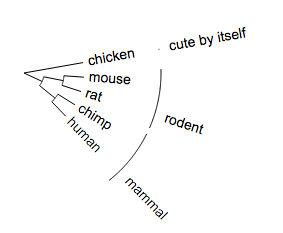
Example 6, textorientation=horizontal|vertical ; NOTE the difference with 'textalign':
## -- textorientation specifies the orientation of group labels relative to leaf labels
!GroupLabel	textorientation=vertical
chicken	text=cute by itself
mouse,rat	text=rodent
chimp,human	text=mammal
Example 7:
## -- textorientation can be used in combination with textalign --
!GroupLabel	textalign=end,textorientation=vertical
chicken	text=cute by itself
mouse,rat	text=rodent
chimp,human	text=mammal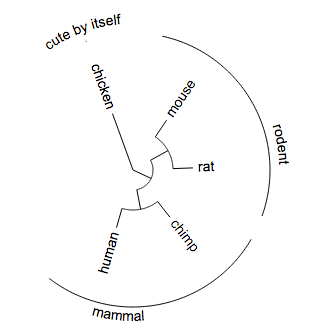
Example 8, use linewidth and linestyle to change the looks of group lines:
!GroupLabel	linewidth=10,linestyle=dashed,color=red,fontcolor=black
chicken	text=cute by itself
mouse,rat	text=rodent
chimp,human	text=mammal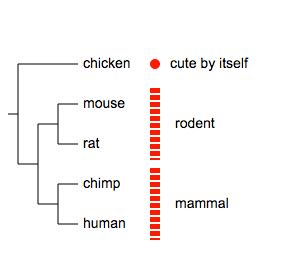
Example 9, by default, the settings in GroupLabel will be applied to all group labels, however, they could be overridden by local settings:
!grouplabel	color=pink,show=1,fontsize=14,fontitalic=0,textalign=middle,textorientation=horizontal,linewidth=2
chicken	text=cute by itself,linewidth=4
mouse,rat	text=rodent,linecolor=darkgrey,fontcolor=purple,linestyle=dashed,textalign=middle
chimp,human	text=mammal,color=darkgreen,textorientation=vertical,linewidth=4,fontsize=16,textalign=end
Add group label to collapsed trees
Evolview supports collapsing at internal nodes; collapsed nodes are treated as leaf nodes. It is therefore very straightforward to add group labels to a collapsed tree. See here for more information.
