- Add new tree to project
- Change the branch and leaf colors of the tree
- Upload datasets to tree
- Add pie charts to the tree
- Add bar plots to the tree (next to the leaf labels)
- Add dot plots to tree
- Add colored objects/ shapes to the tree (next to the leaf labels)
- Add Heatmap data to tree
- Show/Hide bootstrap,branch length values
- Multiple column plots with Evolview trees
- Add Timeline view to Evolview tree
- Export the tree to pdf file
QUICK START
Add pie charts to the tree
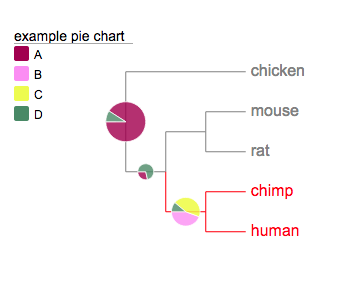
From this section we'll add some more complicated datasets to the tree. First of all, some pie charts; the pies will be displayed on the tree branches.
- click the "piechart" icon on the "Annotation upload" tab:
- copy and paste the following to the text box of the popup dialog box:
Select the "Sample tree 1" from upload tree window to load the following tree.Here is tree in newick format:
(chicken,((mouse,rat),(chimp,human)));## created at may 25, 2011
## before the 'data section', now we have a new section that contains
## lines starting with '!'; this section is called the 'modifier section' because
## it's used to change / modify the default behaviors of the dataset
!Groups A,B,C,D
!colors #9F0251,#f88ef9,#effc00,#4D8963
!legendstyle rect
!title example pie chart
!maxradius 20
!minradius 8
!opacity 0.8
chicken,human 50,0,0,5
mouse,human 10,0,0,25
chimp,human 0,20,20,5
