- Add new tree to project
- Change the branch and leaf colors of the tree
- Upload datasets to tree
- Add pie charts to the tree
- Add bar plots to the tree (next to the leaf labels)
- Add dot plots to tree
- Add colored objects/ shapes to the tree (next to the leaf labels)
- Add Heatmap data to tree
- Show/Hide bootstrap,branch length values
- Multiple column plots with Evolview trees
- Add Timeline view to Evolview tree
- Export the tree to pdf file
QUICK START
Multiple column plots with Evolview trees
Follow the Upload dataset steps. Select the upload Column plots dataset option.
Let's see some examples:
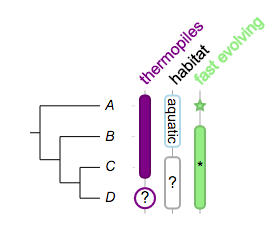
Select the "Sample tree 2" from upload tree window to load the following tree.Here is tree in newick format:
(A:0.1,(B:0.2,(C:0.3,D:0.4)100:0.05)100:0.1)90:0.43;
Datasets and visualisation results:
##
!columnplots	strokewidth=2,fontbold=1,fontsize=16,textangle=-45,spacebetweencolumns=15

## a column of data starts with a 'namedcolumn',
## it defines global options for the corresponding column
namedcolumn=thermopiles,color=purple:darker
	## followed by the following fragments
	from=A,to=C
	from=D,color=white:purple,text=?,width=20,style=circle,textangle=0

## -- 2nd column
namedcolumn=habitat,width=15
	from=A,to=B,text=aquatic,textangle=90,color=white:lightblue,fontsize=14
	from=C,to=D,text=?,textangle=0,color=white:darkgrey

## -- 3rd column
namedcolumn=fast evolving,color=lightgreen:darker
	from=A,style=star
	from=B,to=D
	from=C,style=none,text=*,textangle=0,width=20