- Add new tree to project
- Change the branch and leaf colors of the tree
- Upload datasets to tree
- Add pie charts to the tree
- Add bar plots to the tree (next to the leaf labels)
- Add dot plots to tree
- Add colored objects/ shapes to the tree (next to the leaf labels)
- Add Heatmap data to tree
- Show/Hide bootstrap,branch length values
- Multiple column plots with Evolview trees
- Add Timeline view to Evolview tree
- Export the tree to pdf file
DATASETS
STROKE COLOR AND WIDTH
Table of contents
Overview
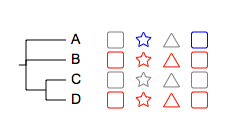
One potential use of stroke colour is to make hollowed shapes like the following:

here is the tree:
(A:0.1,B:0.2,(C:0.3,D:0.4)100:0.5)90:0.43;##color strips
!defaultstrokewidth 1
!type rect,star,triangle,rect
!showlegends 0
A white:grey,white:blue
B white:red
C white:grey
D white:redfill_color[:stroke_color](_stroke_color)
Related modifiers
NOTE: not all datasets support these modifiers. !defaultStrokeWidth
By default, a stroke width of '1' (one pixel) will be used; this can be changed by using a modifier:
!defaultStrokeWidth stroke_width_value
Note:
- always separate the key and attributes with a single TAB character
- this value will be applied to all shapes.
!defaultStrokeColor
A default colour can also be specified by the following modifier:
!defaultStrokeColor valid_stroke_color
and it will be applied to shapes without user-supplied stroke colours.
Examples
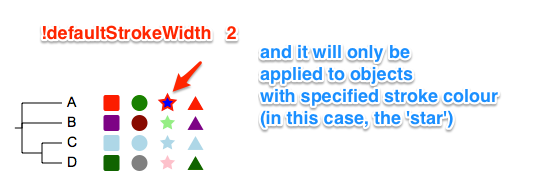
Example 1:
##color strips
!defaultstrokewidth	2
!type	rect,circle,star,triangle
!showlegends	1
A	red,green,blue:red
B	purple,darkred,lightgreen
C	lightblue
D	darkgreen,grey,pink

Example 2:
##color strips
!defaultstrokewidth	2
!defaultstrokecolor	gold
!type	rect,circle,star,triangle
!showlegends	1
A	red,green,blue:red
B	purple,darkred,lightgreen
C	lightblue
D	darkgreen,grey,pink

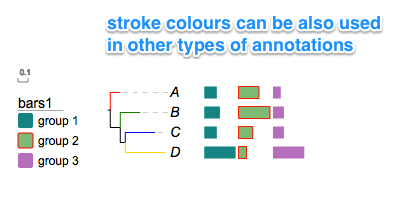
Example 3:
## a bar plot
!groups	group 1,group 2,group 3
!colors	#028482,#7ABA7A:red,#B76EB8
!align
!itemHeightPCT	60
A	8,13,5
B	10,20,7
C	8,9,7
D	20,5,20
Use 'darker' or 'brighter' as stroke
When color is specified and is not 'black' or 'white', users can now use darker or brighter version of the specified color as stroke color.
For example, the following usages are all valid:
- red:darker
- #FF00FF:lighter
- darkblue:brighter
Here is an example, more examples will come.
Let's use the tree mentioned above.
## a bar plot uses 'darker' and 'brighter' as stroke colors
## see the !colors line below:
!defaultstrokewidth	3

## -- now you can use 'darker' or 'lighter' as stroke color
!groups	group 1,group 2,group 3
!colors	#028482,#7ABA7A:darker,#B76EB8:lighter

!title	Example of barplots 4
!plotwidth	200
!showLegends	0
!itemheightPCT	75
!align
A	8,13,5
B	10,20,7
C	8,9,7
D	20,5,20