- Add new tree to project
- Change the branch and leaf colors of the tree
- Upload datasets to tree
- Add pie charts to the tree
- Add bar plots to the tree (next to the leaf labels)
- Add dot plots to tree
- Add colored objects/ shapes to the tree (next to the leaf labels)
- Add Heatmap data to tree
- Show/Hide bootstrap,branch length values
- Multiple column plots with Evolview trees
- Add Timeline view to Evolview tree
- Export the tree to pdf file
QUICK START
Add bar plots to the tree (next to the leaf labels)
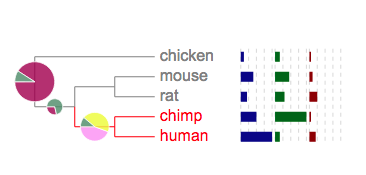
Here we'll add some bar plots to the tree; the bars will be plotted next to the leaf labels.
Select the "Sample tree 1" from upload tree window to load the following tree.Here is tree in newick format:
(chicken,((mouse,rat),(chimp,human)));
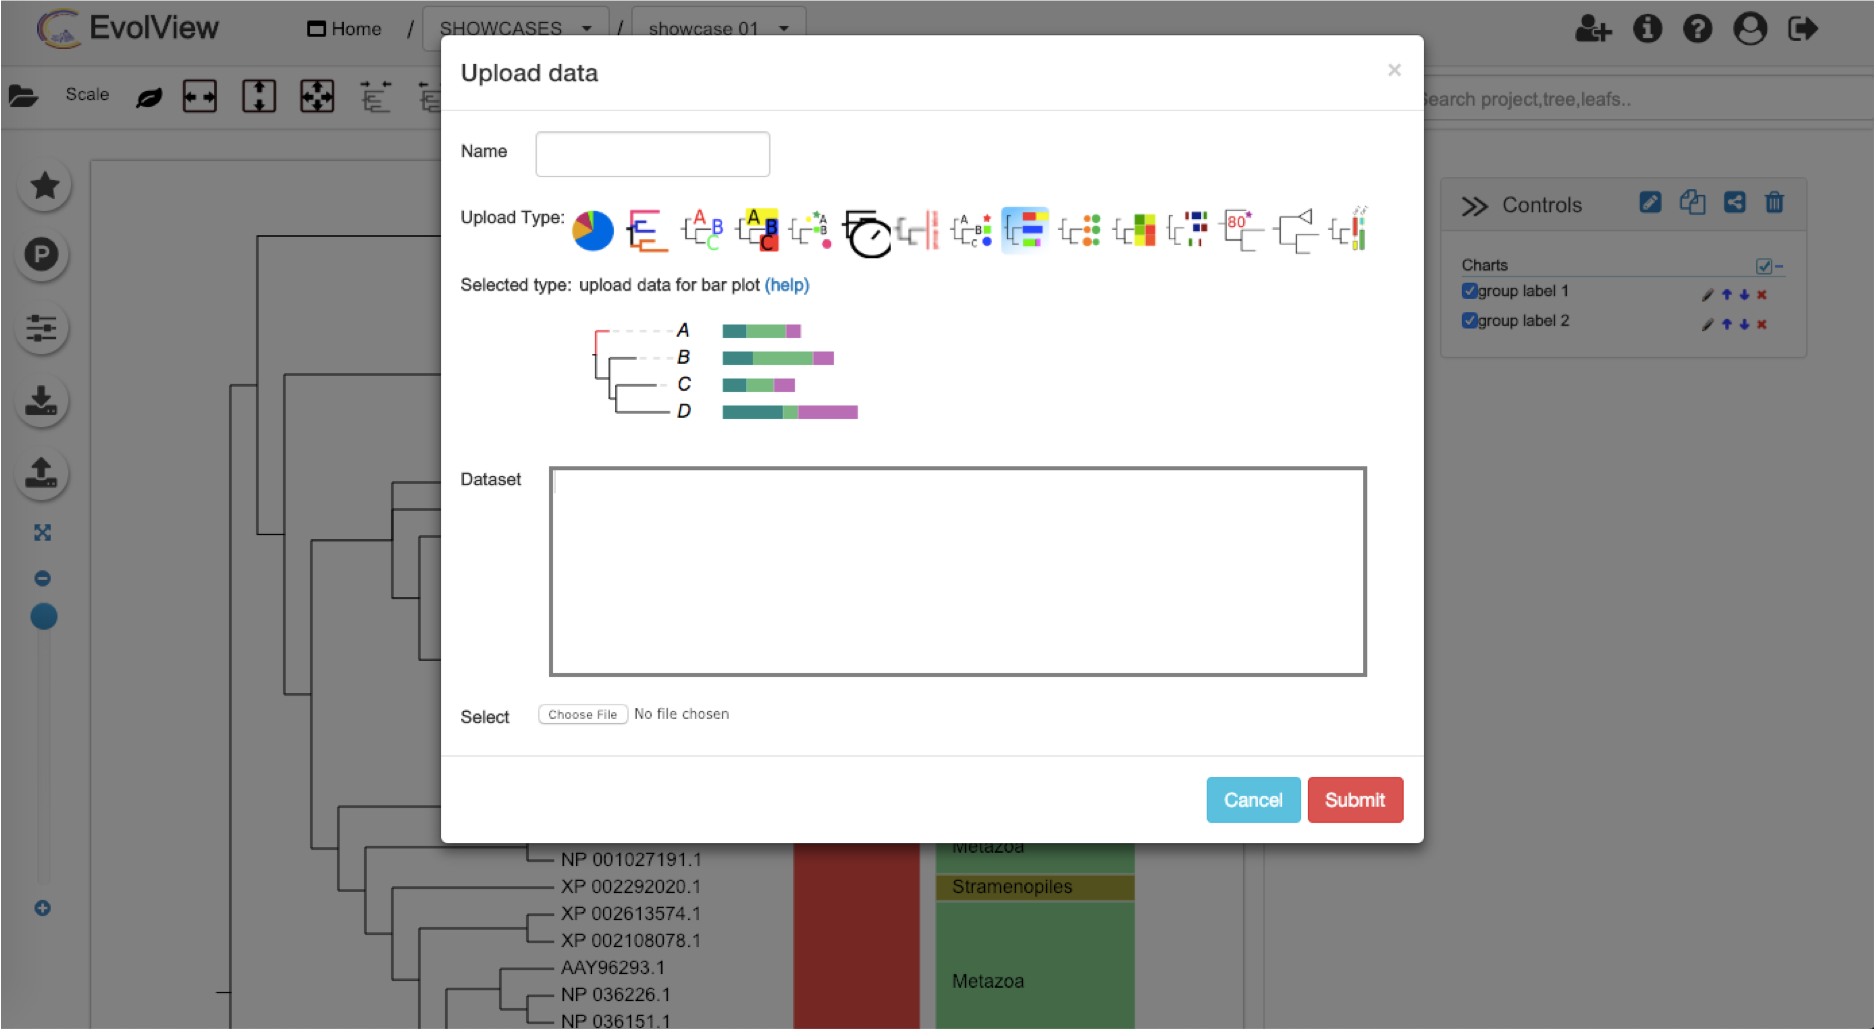
First of all, click the "bar plots" icon on the "Annotation upload" tab:

choose a name for the dataset and copy and paste the following to the text area in the popup dialog box:
##barplots
!groups	a,b,c
!colors	darkblue,darkgreen,darkred
!showLegends	0
!plotwidth	100
!align
!grid
chicken	2,3,1
mouse	8,9,2
human	20,3,4
chimp	10,20,1
rat	4,6,5
